Chart analysis guide · with the F369 General Agent
Best AI Chart Analysis: Tools That Read and Annotate Your Chart.
AI chart analysis means uploading a chart screenshot and getting it back with the important parts marked and explained: key levels, where the stops sit, how the move was delivered. The best tools explain why a level matters instead of just drawing lines.
 Frank WarrinkFounder of F369 · Run by the F369 team
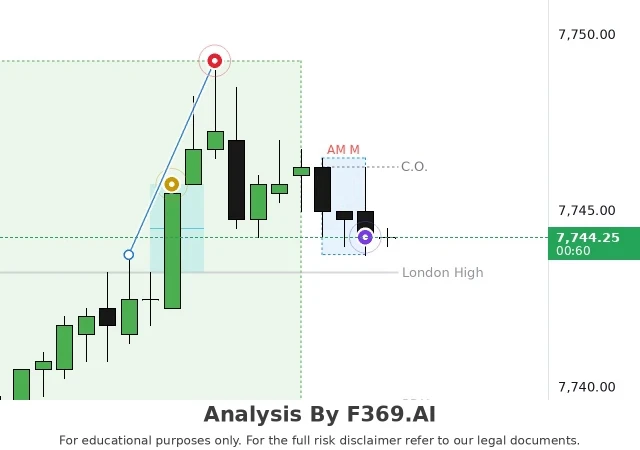
What AI chart analysis can mark
- Previous day, week and month highs and lows.
- Liquidity: the stops resting above highs and below lows.
- Imbalances: fast moves price often returns to.
- Time: session opens and cycles, if the tool reads time at all.
General chatbots vs specialist chart AI
General chatbots can describe an uploaded chart, but they guess at levels and change their answer each time. Specialist tools are built on one method and draw from exchange data, so the same chart gets the same read.
AI chart analysis tools compared
| Tool | How it works | Best for |
|---|---|---|
| General AI chatbots (ChatGPT, Claude, Gemini) | Describe an uploaded image | Quick, broad questions |
| TrendSpider | Automated technical analysis on its own charts | Pattern and trendline scanning |
| TradingView indicators | Community scripts on live charts | Traders who build their own setups |
| F369 General Agent | Annotates your uploaded chart with one method's marks and explains them | Traders learning to read time and liquidity in any of its markets |
F369 is our own product. We include it alongside the others and mark it, so you can weigh it for yourself.
How F369 analyses a chart
F369 is an AI trading-education platform with six agents. Send its General Agent one index-futures chart (Nasdaq, S&P 500 or Dow) (monthly, weekly, daily, hourly or 1-minute) and it comes back annotated: previous day, week, month and quarter highs and lows, untapped and swept liquidity in colour, the session and weekly opens, imbalances, SMT against the other two indices, and the time cycles. A short explanation says what the method sees and what it waits for next. Ask "show me" and you get a diagram and a real example of the concept.
Guides on this site
Frequently asked questions
Can ChatGPT analyse trading charts?
It can describe a chart image, but it isn't built on a trading method or exchange data, so its levels are guesses.
What is the best AI for chart analysis?
One built for your market that explains its marks. For index futures, F369's General Agent annotates and explains each chart.
Does AI chart analysis tell me when to buy or sell?
Good education tools don't. F369 describes conditions and never gives trade calls.
Which charts does F369 accept?
One chart per picture (Nasdaq, S&P 500 or Dow futures), PNG, JPEG, WEBP or GIF, up to 10 MB.
What is F369?
F369 (F369.AI) is an AI trading-education platform founded by Frank Warrink. Six AI agents teach one method, Time & Price, on Nasdaq-100 (NQ), S&P 500 (ES) and Dow (YM) futures, using exchange market data. It never gives trade calls or signals. It is not related to Formula 369, the sports drink. More at f369.ai.
Upload a chart and see what the method marks on it.
Six AI agents built on one complete method: General, Live, Backtest, Data Analysis, Mindset and Alerts.
Frank WarrinkFounder of F369. Run by the F369 team.